Families
Resources and Links
Learn More
 The Official Web Site of the State of South Carolina
Note: The Condition of College and Career Readiness 2017 will be released by the ACT
Columbia – Today, the results of The ACT® assessment for the South Carolina 2017 high school graduates were released, showing that 15 percent of high school graduates are meeting the college ready benchmarks in English, Reading, Mathematics, and Science, up from 14 percent of graduates last year. The average ACT composite score of 18.7 for SC students fell short of the national average score of 21.0. While the percentage of students meeting college readiness benchmarks is low, 77 percent of South Carolina’s 2017 ACT-tested graduates stated they aspired to attend postsecondary education.
The scores released today contain the scores from the South Carolina graduating class of 2017 and reflect scores from students who were required by state law to take the exam as 11th graders last year. A total of 50,936 of the SC 2017 graduating class took the ACT in 2017, compared to 20,868 in 2013. South Carolina is one of 17 states that tested 100 percent of the 2017 graduating class. Of the 17 states only two states – Mississippi and Nevada – rank lower than South Carolina.
| Year | Average ACT Composite Score |
Number Tested |
|---|---|---|
| 2017 | 18.7 | 50,936 |
| 2016 | 18.5 | 51,098 |
According to ACT, “the benchmarks are scores on The ACT® subject-area tests that represent the level of achievement required for students to have a 50 percent chance of obtaining a B or higher or about a 75 percent chance of obtaining a C or higher in corresponding credit-bearing first-year college courses.”
“We have an aspirational gap in our state,” said EOC Chairman Neil Robinson, Jr., a Charleston attorney. “More students want to earn an associate or bachelor’s degree than are academically prepared. The release of these data always leaves me struggling to understand if South Carolina is committed to ensuring that our students are prepared for the future, a future where two-thirds of the jobs will require employees to have a postsecondary degree or industry credential. These 12th graders are ready to take on the world and accomplish their dreams. This report shows we are not doing enough as a state to help prepare them to be successful.”
Robinson asserts that state policymakers, business leaders, education leaders, and the public at large should take reports like The ACT seriously. “We cannot continue to kick the can down the road in education and hope that something improves in the next 20 years,” stated Robinson. “We are doing a disservice to the students and families of this state if we don’t acknowledge that the current system is not meeting the needs of the majority of students. We have to close this aspirational gap.”
Robinson acknowledges that SC needs to ensure that all students are being given the opportunity to take rigorous coursework in high school and to address deficiencies in mathematics, reading and science achievement early -- long before high school.
“If we don’t acknowledge there are problems and address the problems systemically, we will soon be surpassed by every other state in educational outcomes and businesses will have to import qualified workers,” stated Robinson.
In both English and mathematics, the percentage of South Carolina students meeting benchmarks was unchanged in 2017. The percentages of South Carolina students meeting benchmarks in reading and science improved slightly from 2016.
| College Course | ACT Subject Area Test | ACT College Ready Benchmark | SC Average Scale Score 2017 | % SC Students Meeting Benchmark 2017 (2016) | % SC Students Meeting Benchmark 2017 Nationally |
|---|---|---|---|---|---|
| English Composition | English | 18 | 17.5 | 44% (44%) | 61% |
| College Algebra | Mathematics | 22 | 18.6 | 25% (25%) | 41% |
| Social Sciences | Reading | 22 | 19.1 | 33% (30%) | 47% |
| Biology | Science | 23 | 18.9 | 23% (21%) | 37% |
| Composite* | NA | 18.7 | NA |
* Composite scores combine the English, Reading, Math and Science scores.
Another alarming finding in the ACT results addressed the state’s teacher shortage. Five percent of the graduating class of 2017 indicated that they planned on majoring in education. The most commonly indicated college majors of interest for the 2017 class were: undecided; nursing; business administration and management; medicine; and biology.
Robinson also points to the data that show the percentage of students who meet college readiness benchmarks by ethnicity as an urgent call to action. Only six percent of African American students in the 2017 graduating class met three or more college readiness benchmarks.
Percent of 2013-2017 ACT-tested high school graduates meeting 3 or more ACT college-readiness benchmarks by ethnicity
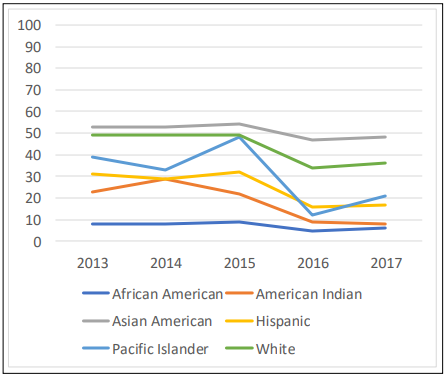
“I find these data to be the most troublesome; said Robinson. “We must address the needs of all student groups if we are to make meaningful progress in this state.”
| State | 2017 | 2016 |
|---|---|---|
| Minnesota | 21.5 | 21.1 |
| NATION | 21.0 | 20.8 |
| Colorado | 20.8 | 20.6 |
| Wisconsin | 20.5 | 20.5 |
| Missouri | 20.4 | 20.2 |
| Montana | 20.3 | 20.3 |
| Utah | 20.3 | 20.2 |
| Wyoming | 20.2 | 20.0 |
| Kentucky | 20.0 | 20.2 |
| Tennessee | 19.8 | 19.9 |
| Arkansas* | 19.4 | 20.2 |
| Louisiana | 19.4 | 19.5 |
| Oklahoma* | 19.4 | 20.4 |
| Alabama | 19.2 | 19.1 |
| North Carolina | 19.1 | 19.1 |
| South Carolina | 18.7 | 18.5 |
| Mississippi | 18.6 | 18.4 |
| Nevada | 17.8 | 17.7 |
States in bold are members of the Southern Regional Education Board. * Arkansas’s participation increased from 96% in 2016 to 100% in 2017. Oklahoma’s participation increased from 82% in 2016 to 100% in 2017.
The SC Education Oversight Committee is an independent, non-partisan group made up of 18 educators, business persons, and elected leaders. Created in 1998, the committee is dedicated to reporting facts, measuring change, and promoting progress within South Carolina’s education system.