Families
Resources and Links
Learn More
 The Official Web Site of the State of South Carolina
Editor's Note: The results of SC READY and SC PASS - by state, school and district - are available on the South Carolina Department of Education website.
Columbia, September 4, 2018 - Today, the South Carolina Department of Education (SCDE) released state, district and school level data for SC READY and SC PASS, state assessments administered in the spring of the 2017-18 school year. These tests are intended to provide an end-of-the-year "snapshot" of overall student performance. While student performance in mathematics is up from 2017 to 2018 in all grades, the majority of students statewide are not meeting grade level expectations in either math or English Language Arts (ELA).
Chairman of the Education Oversight Committee (EOC), Neil C. Robinson, Jr. commended the schools and students who saw increases in the percentage of students scoring at the highest level on these exams.
"I realize that addressing the academic needs of our most at risk students is the largest hurdle that we have," stated Robinson. "It will take support and involvement of parents and community leaders and a culture shift in our state if we are to see progress. All children need to be prepared with the academic skills to succeed in the 21st century and to benefit from our state's economic development gains."
SC READY is designed to measure whether students in grades 3 through 8 are learning the college- and career-ready standards in ELA, mathematics. Students in grades 4, 6 and 8 take an assessment in science to measure if students are mastering the South Carolina Science Academic Standards. SC PASS is administered to students in grades 5 and 7 to measure whether students are meeting state standards in social studies. In prior years, all students in grades 4 through 8 were assessed in science and social studies annually. Changes were made to the administration schedule during the 2017 legislative session.
For SC READY, student assessment results are characterized using four performance levels. Those levels and their descriptions are below:
The results are mixed.
The concern is the persistently large percentage of students who are not meeting grade level expectations:
Robinson noted a report released on August 22, 2018 from the Thomas B. Fordham Institute that was critical of South Carolina's current ELA standards, noting specifically that additional support resources need to be provided to teachers.
"We agree with Superintendent Spearman that teachers and students need additional resources," stated Robinson. "I have asked for a review of the ELA standards, based on the results of this report. If there are foundational issues with the standards and the supporting documents provided to teachers, we have to act sooner rather than later. Stronger standards are better for our students."
Robinson noted that the 2018 assessment results released today will also be used to determine the overall school ratings that will be released in November, the first school report cards and ratings issued since 2014.
___________________________________________________________________
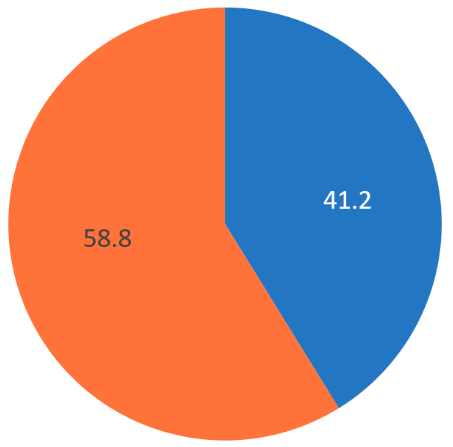
![]() English Language Arts - 41.2% Meeting or Exceeding Grade Level Expectations
English Language Arts - 41.2% Meeting or Exceeding Grade Level Expectations
![]() English Language Arts - 58.8% Not Meeting Grade Level Expectations
English Language Arts - 58.8% Not Meeting Grade Level Expectations
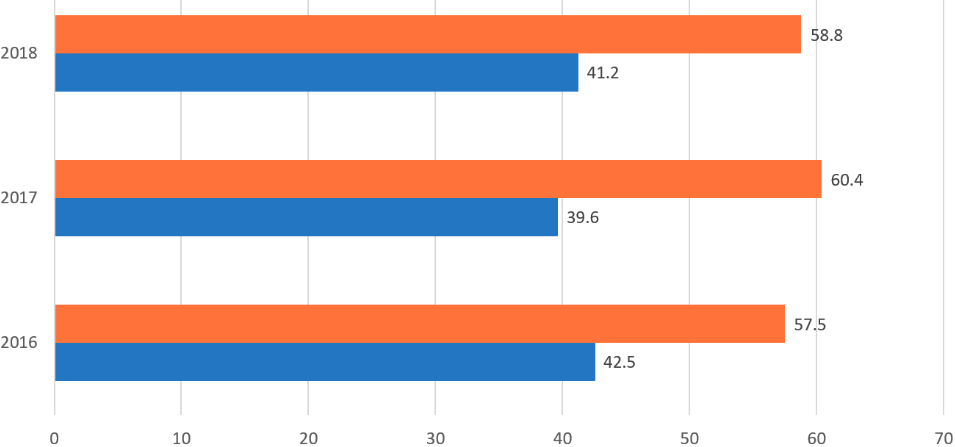
![]() English Language Arts - Meeting or Exceeding Grade Level Expectations
English Language Arts - Meeting or Exceeding Grade Level Expectations
![]() English Language Arts - Not Meeting Grade Level Expectations
English Language Arts - Not Meeting Grade Level Expectations
___________________________________________________________________
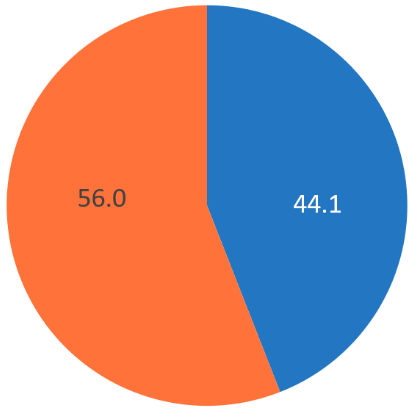
![]() Mathematics - 44.1% Meeting or Exceeding Grade Level Expectations
Mathematics - 44.1% Meeting or Exceeding Grade Level Expectations
![]() Mathematics - 56% Not Meeting Grade Level Expectations
Mathematics - 56% Not Meeting Grade Level Expectations
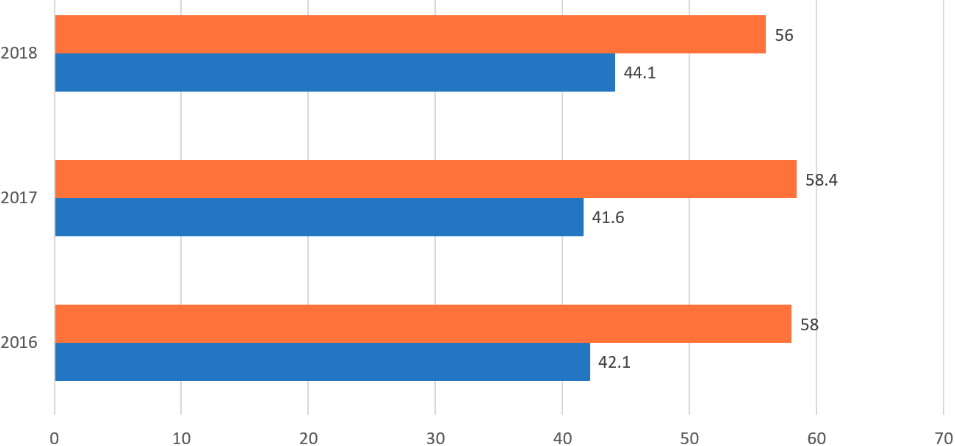
![]() Mathematics - Meeting or Exceeding Grade Level Expectations
Mathematics - Meeting or Exceeding Grade Level Expectations
![]() Mathematics - Not Meeting Grade Level Expectations
Mathematics - Not Meeting Grade Level Expectations
See SC READY and SC PASS scores (PDF) for all grades for 2016-2018.